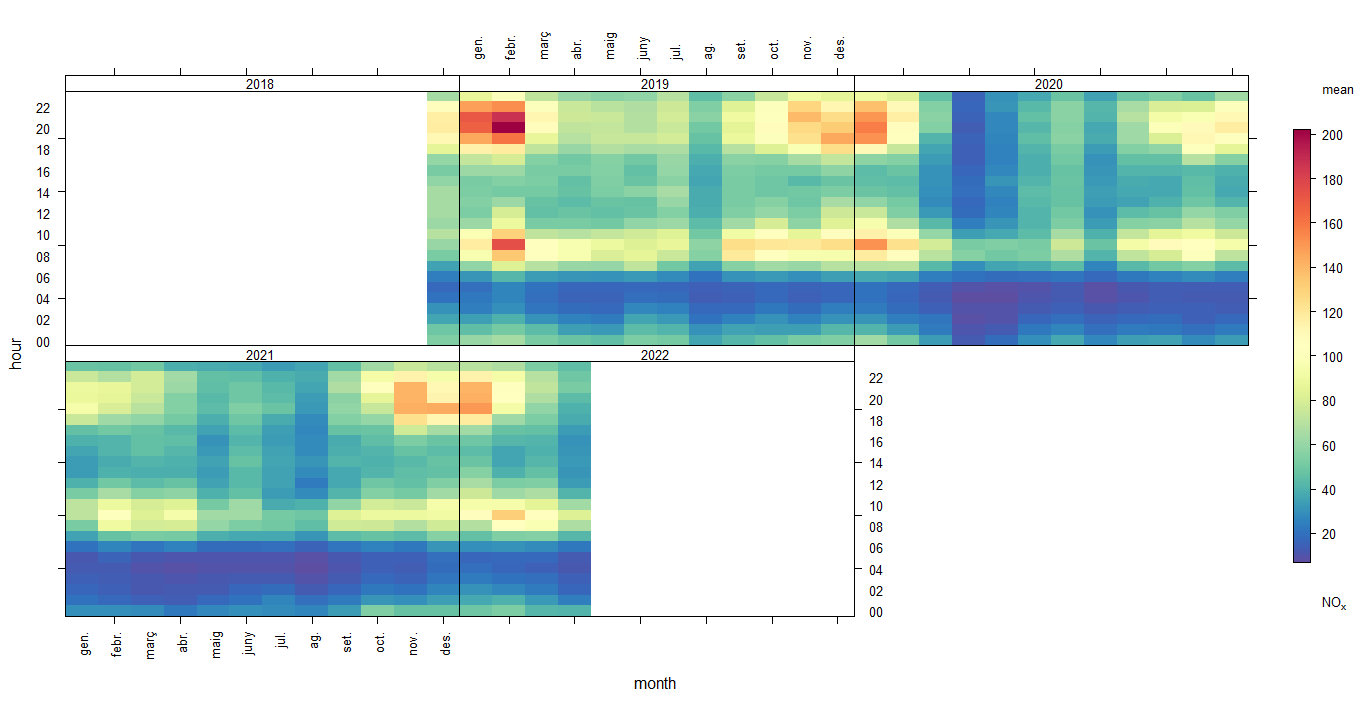
 > trendLevel(pivotw1, pollutant = "nox")
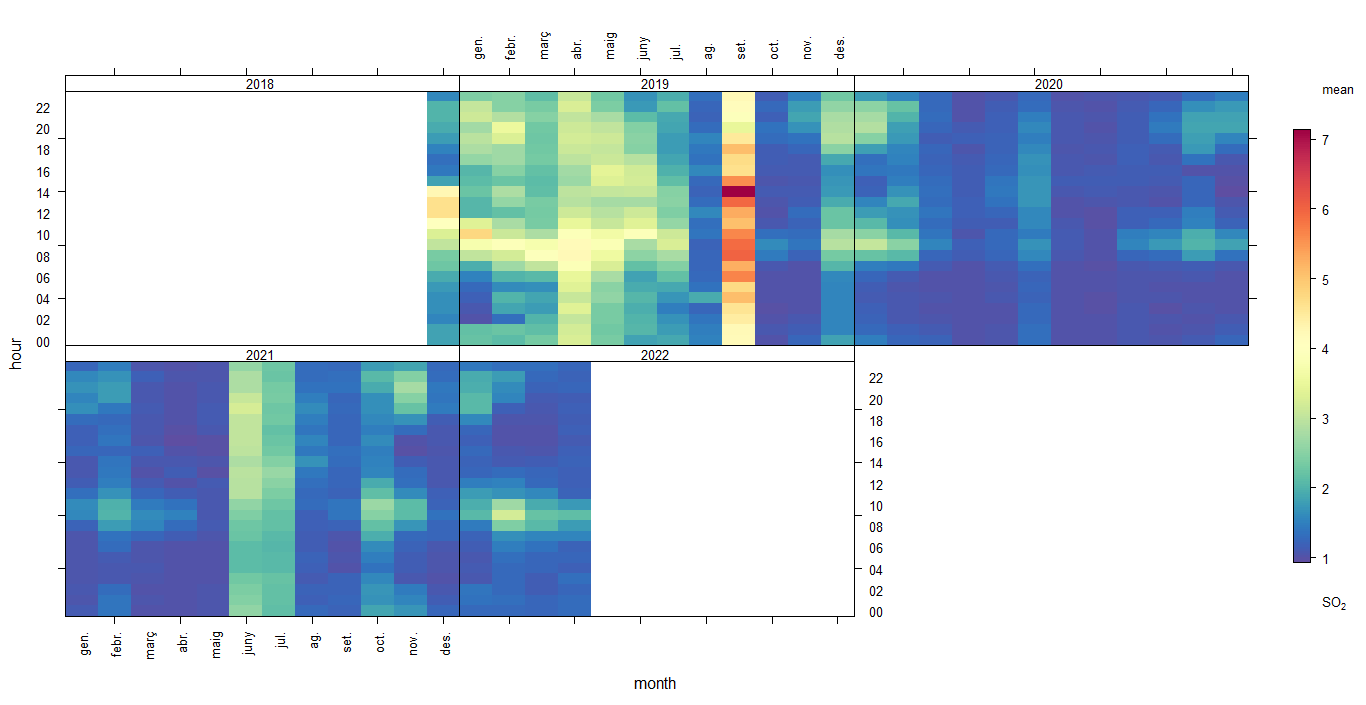
 > trendLevel(pivotw1, pollutant = "so2")
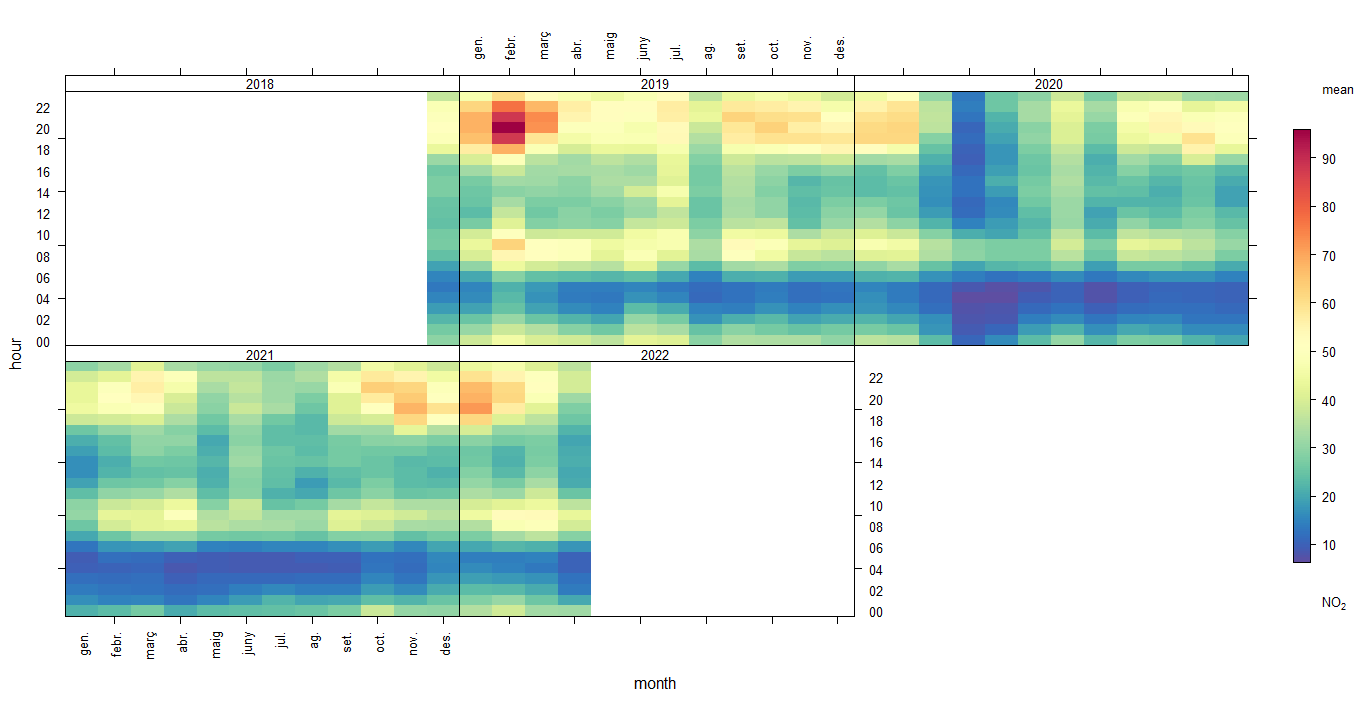
 > trendLevel(pivotw1, pollutant = "no2")
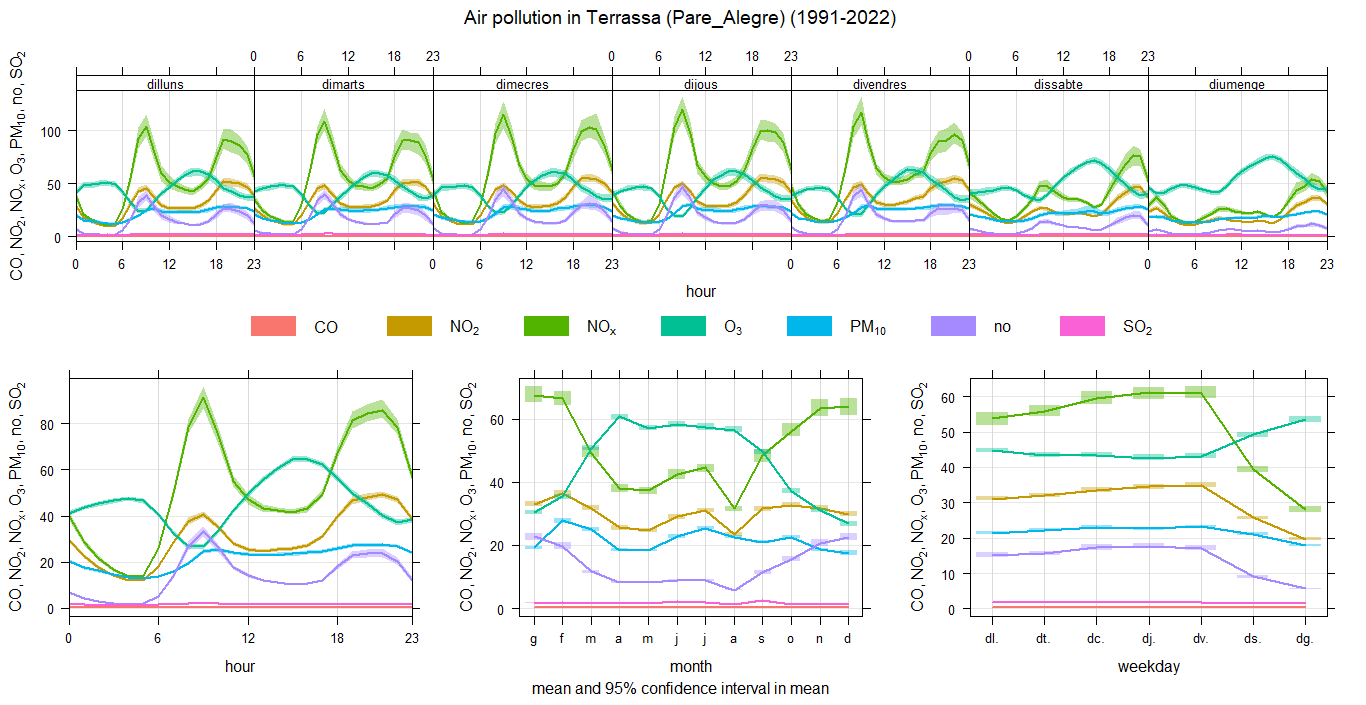
Here you can see all the graphics I have created: One of the most important things in this code is to create the "pivotw":
> timeVariation(pivotw1, pollutant = c("co","no2","nox","o3","pm10","no","so2"), main="Air pollution in Terrassa (Pare_Alegre) (2019-2022)")
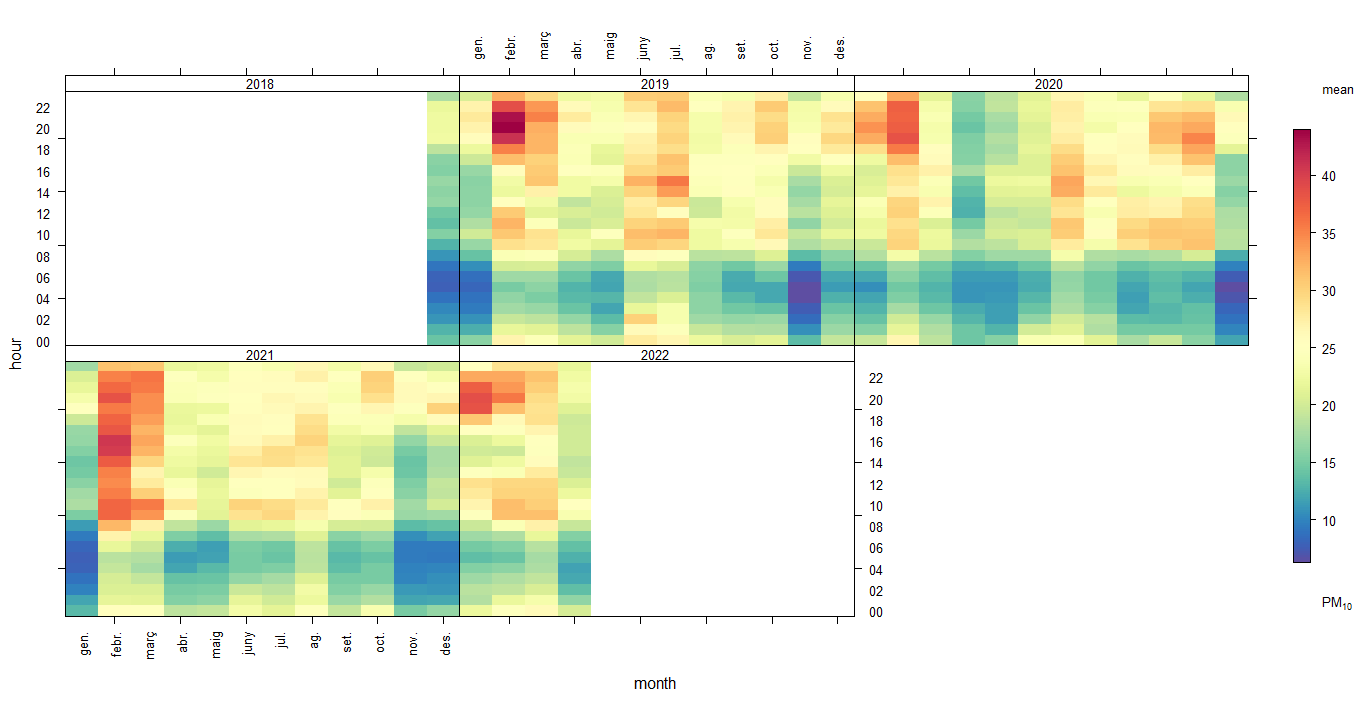
> trendLevel(pivotw1, pollutant = "pm10")
> trendLevel(pivotw1, pollutant = "nox")
> trendLevel(pivotw1, pollutant = "so2")
> trendLevel(pivotw1, pollutant = "no2")
> pollutionRose(pivotw1, pollutant="no2")
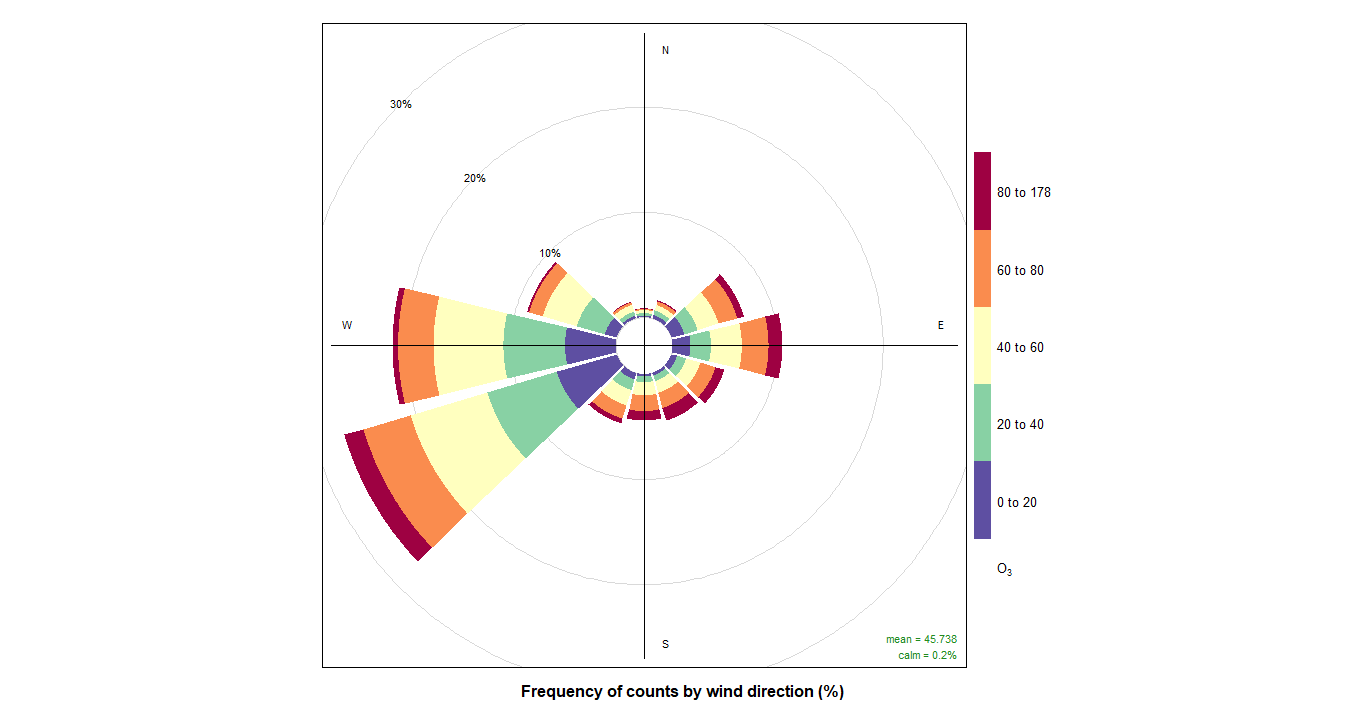
 > pollutionRose(pivotw1, pollutant="o3")
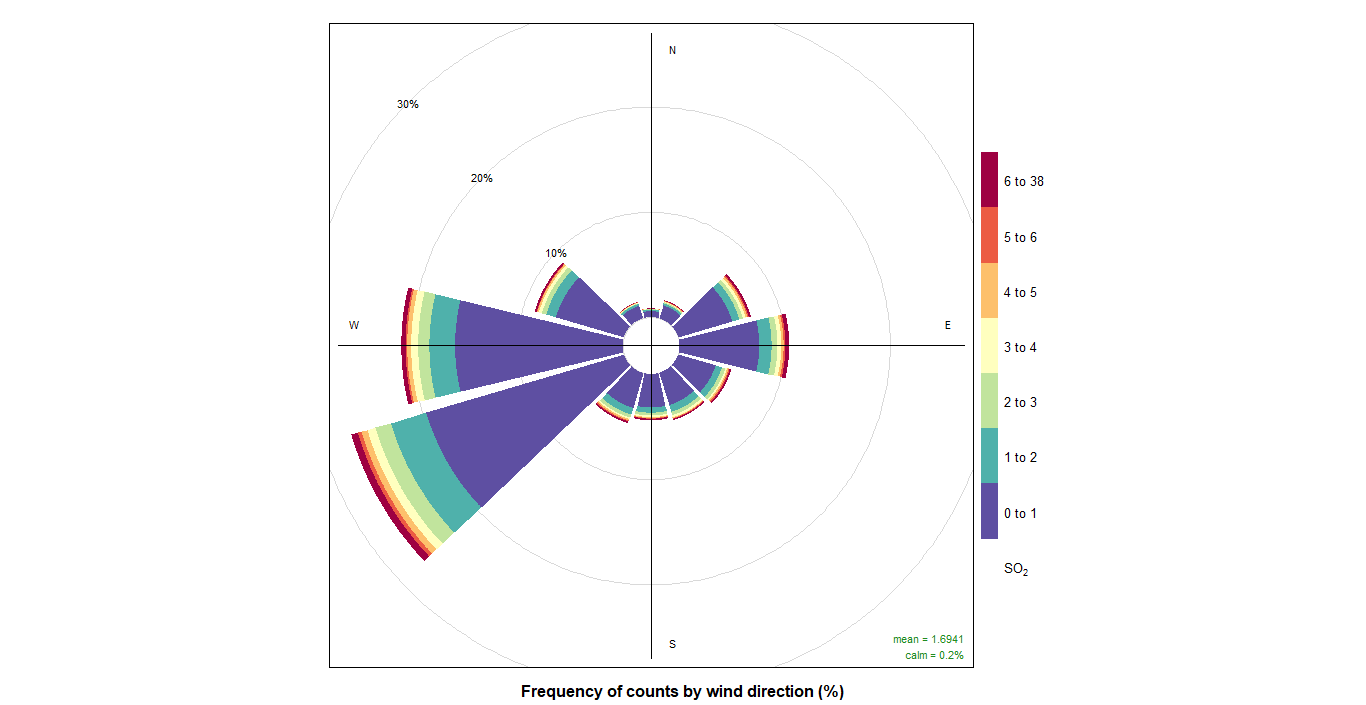
 > pollutionRose(pivotw1, pollutant="so2")
 > pollutionRose(pivotw1, pollutant="pm10")

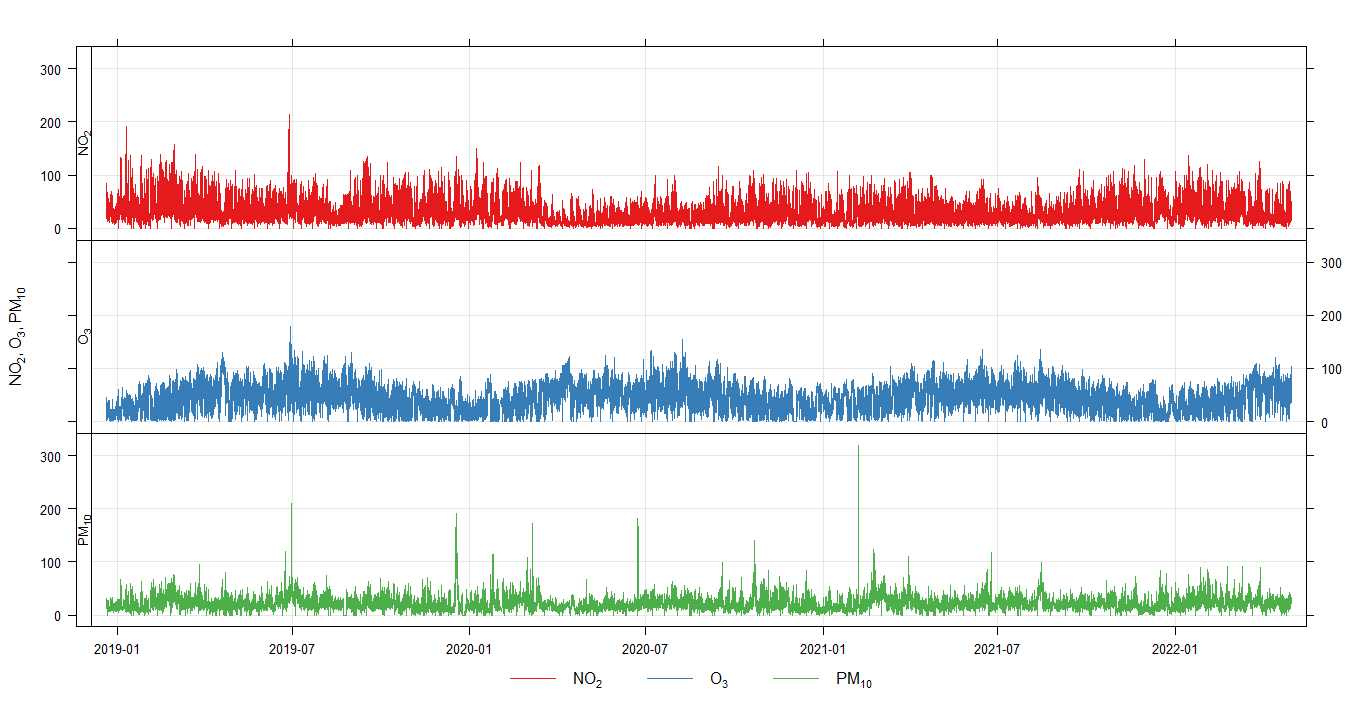
timePlot(pivotw1, pollutant=c("no2","o3","pm10", so2“”))
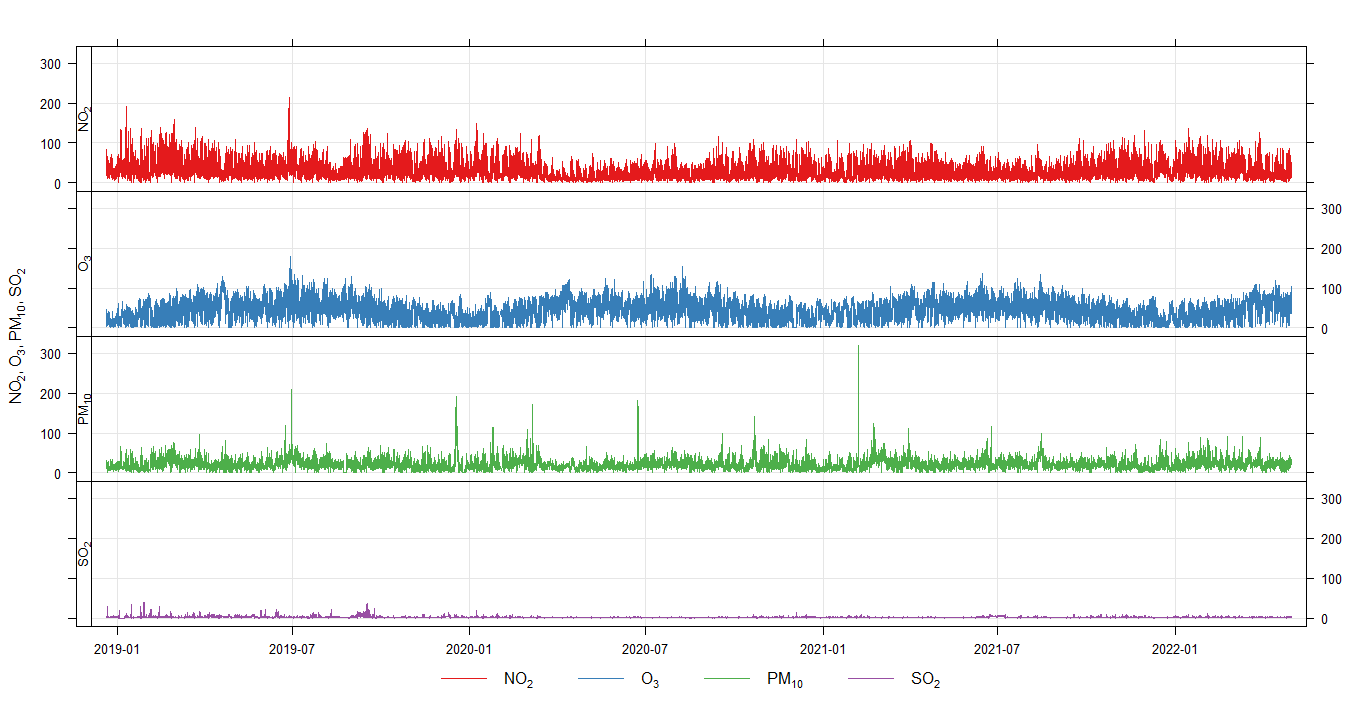
timePlot(pivotw1, pollutant=c("no2","o3","pm10"))
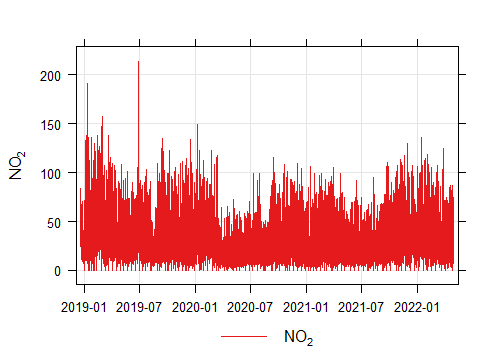
timePlot(pivotw1, pollutant=c("no2"))
timePlot(pivotw1, pollutant=c("o3"))

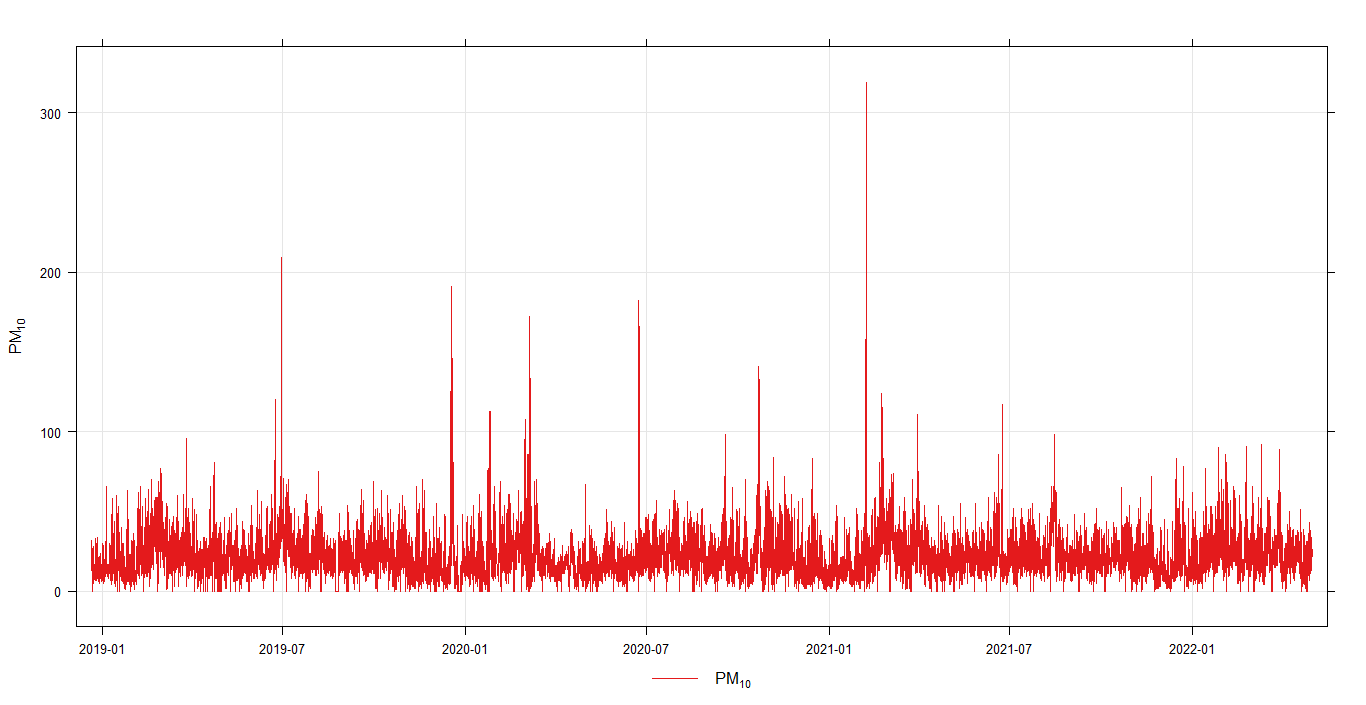
timePlot(pivotw1, pollutant=c("pm10"))
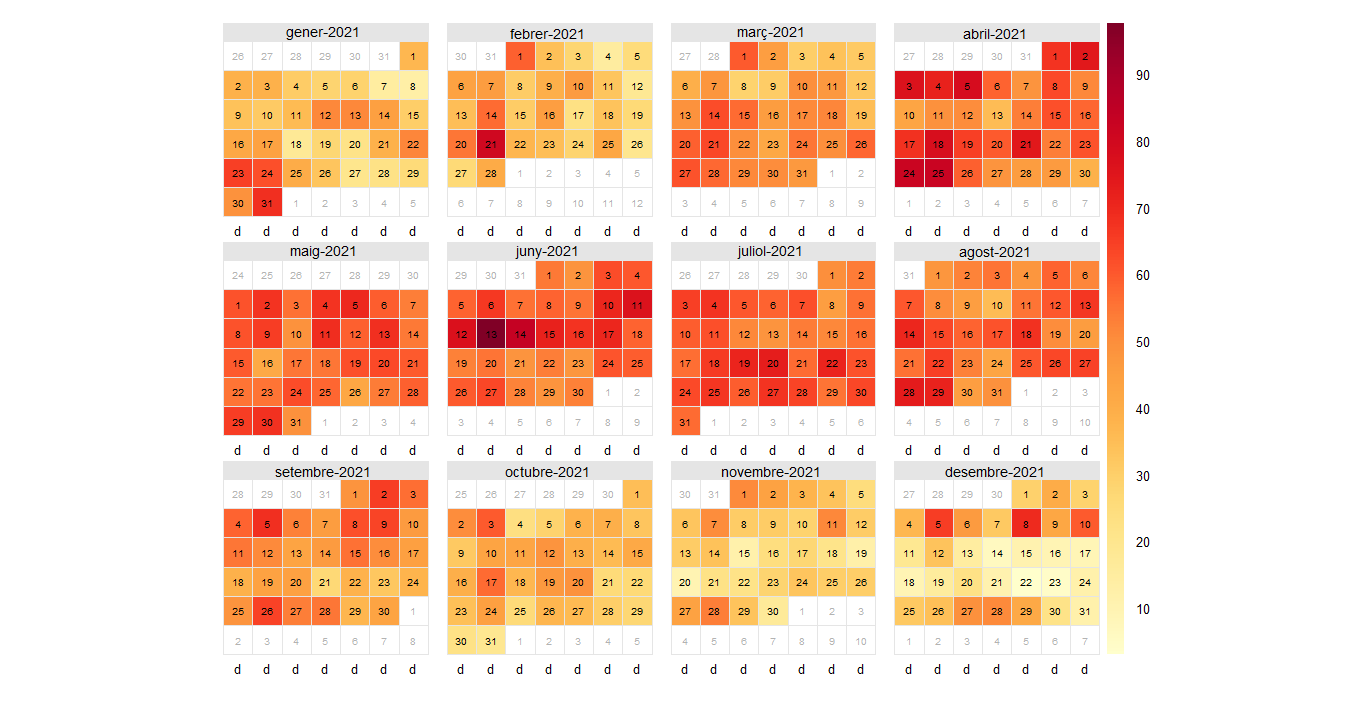
calendarPlot(pivotw1, pollutant="o3", year="2021")
calendarPlot(pivotw1, pollutant="o3", year="2020")

calendarPlot(pivotw1, pollutant="o3", year="2019")

ggplot(data=Fig2, aes(x=date, y=value,color=pollutant))+geom_line()+geom_point()+geom_hline(yintercept=40)
